
Stop Stitching Together CSVs: How to See All Your Creator Revenue in One Place
If you sell across Stripe, Gumroad, PayPal, and Shopify, getting a combined revenue number means downloading four CSVs and hoping your spreadsheet doesn't break. Here's a faster way.
March 10, 2026 · 3 min read

You sell something on Gumroad. You take recurring payments through Stripe. Some customers still send PayPal. Maybe there’s a Shopify store, or a Ko-fi page where people drop tips.
Every month, that means downloading four or five different CSV files with four or five different column naming schemes, date formats, and definitions of what “amount” means. Then you spend an afternoon stitching them together in a spreadsheet, if you bother at all. Most people don’t, and just guess.
That’s a real problem when you’re trying to answer a simple question: how much did I actually make last month?
Why merging payment CSVs always breaks
It looks like it should be easy. Every payment CSV has a date, an amount, and some kind of description. Just combine the rows.
The issue is that each platform invented its own interpretation of those three things.
Stripe’s amount column is in cents. A value of “1000” in your Stripe export is $10.00, not $1,000. If you paste that column into a spreadsheet alongside Gumroad’s dollar-denominated amounts, your totals are off by a factor of 100. This is the most common mistake and it’s completely silent: the spreadsheet just adds the numbers together.
PayPal’s date format changes depending on your account’s regional settings. Some accounts export MM/DD/YYYY, others export DD/MM/YYYY. A transaction dated 05/06/2024 could be May 6th or June 5th, and there’s no header or metadata that tells you which convention the file is using. If you’re comparing across quarters, that ambiguity matters.
Then there’s the non-revenue row problem. Stripe includes payout rows in its transaction export. Those are the transfers from Stripe to your bank account. If you count those alongside your actual payment rows, you’re counting every dollar twice. PayPal mixes in transfer and withdrawal rows the same way. No warning, no separate sheet. They’re just there.
Why spreadsheets become a liability
The standard workaround is a master spreadsheet: one tab per platform, a summary tab that pulls from each with formulas, updated manually every month.
It works right up until Stripe changes a column name in their export (they have). Or PayPal adds a new row type your SUMIF doesn’t filter out. Or someone opens the file on a machine with different locale settings and the date parsing breaks silently.
I’ve seen these spreadsheets turn into load-bearing infrastructure nobody wants to touch. The person who built it left. The formulas reference cells in ways nobody fully understands. The tab for “Gumroad Q2 2023” is still there because nobody’s sure if it’s connected to anything.
Accounting software like Wave or QuickBooks solves this. But it’s built for businesses with inventory, invoicing, and payroll. For most creators, it’s the wrong tool.
What the per-platform breakdown actually reveals
Once everything is normalized into a single timeline, a few things become obvious that per-platform views hide.
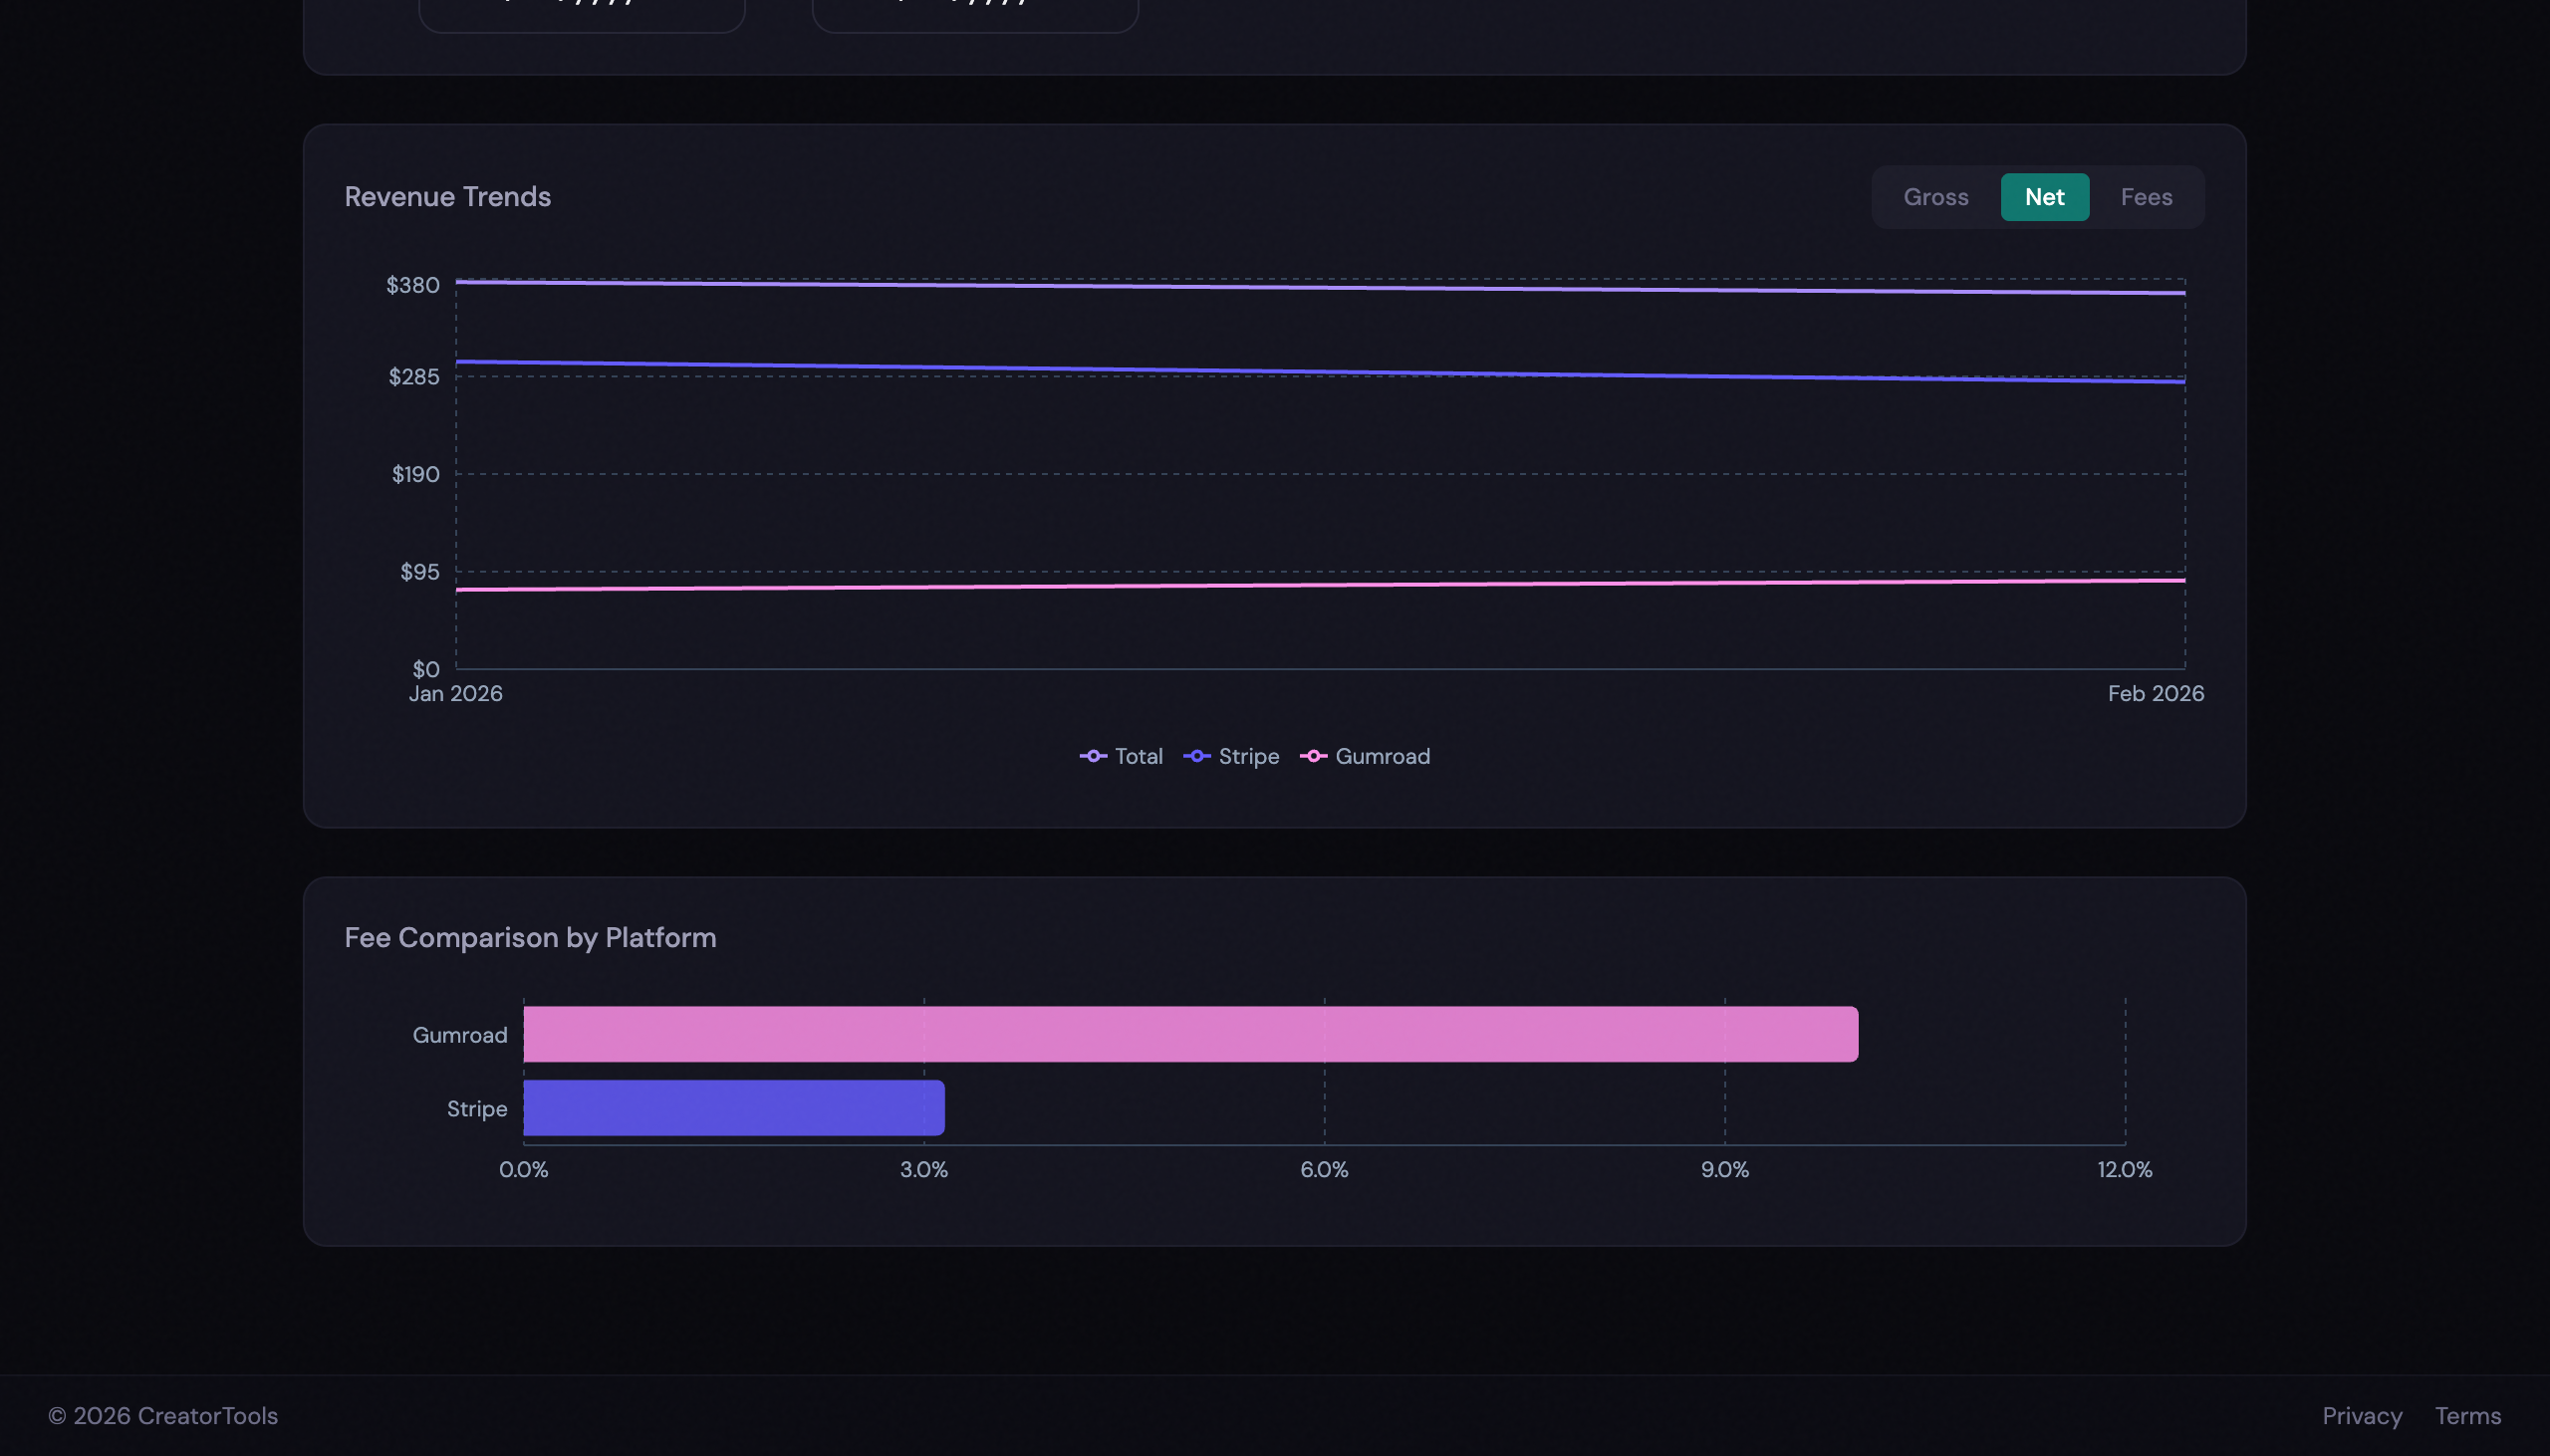
Platform fees aren’t equal. Gumroad’s fee structure has changed multiple times. It was as high as 9% for free-plan sellers before they overhauled their pricing. PayPal charges 2.9% plus a fixed per-transaction fee, which disproportionately eats into small transactions (a $3 tip nets you about $2.82). Stripe is similar. Seeing these compared side by side, in actual dollar amounts pulled from the same period rather than just percentages, makes the real cost of each platform tangible.
Revenue patterns also become visible. A November spike from a holiday sale. A quiet August. A Gumroad launch that moved more in one week than Stripe moved all month. These patterns exist in the individual platform views too, but you notice them differently when they’re on a single timeline.
How to export from each platform
Quick reference for finding the export button on each platform:
- Stripe: Dashboard → Payments → All transactions → Export (top-right corner). Dates are UTC ISO timestamps. Remember the amounts are in cents.
- PayPal: Activity → Statements → Custom date range → Download as CSV. The export mixes payment types: refunds, transfers, and withdrawals all land in the same file.
- Gumroad: Audience → Sales → Export CSV. Straightforward, no filters. You get everything.
- Shopify: Analytics → Reports → Finances summary → Export. Make sure you’re on the Transactions report, not the Orders report. Different columns, different row structure.
- Lemon Squeezy: Payouts → History → Export. Fee columns are sometimes blank on older transactions, so net may not reconcile perfectly for historical data.
- Ko-fi: Account → Transaction History → Export CSV.

Using the Earnings Unifier
The Earnings Unifier handles the normalization step (column mapping, cent conversion, payout row filtering) so you don’t have to.
Upload CSVs from whichever platforms you use. The tool identifies each platform’s column structure, converts Stripe cents to dollars, strips out non-revenue rows like payouts and bank transfers, and maps everything to a common date/gross/fee/net schema. Nothing leaves your browser. The CSV parsing runs entirely client-side.

After clicking “Unify Earnings” you get:
- Summary cards: total gross, total fees, total net, and transaction count across all uploaded files
- Per-platform breakdown showing each platform’s contribution to gross, fees, and net (requires a free account)
- Full transaction table with all transactions in one sortable list: date, description, platform, and amounts
Pro accounts unlock date range filtering, a monthly revenue trend chart, and a fee comparison chart showing what each platform cost in absolute dollars over the same period.
No account required. No install. Just upload your CSVs and go.
Takeaway
Getting a combined revenue number shouldn’t take an afternoon. Export your CSVs, upload them, and you have the full picture in under a minute.
One thing to watch for: if you earn in multiple currencies, the tool sums amounts without converting them. A total that mixes USD and EUR is flagged with a warning, but it’s a straight sum, not an exchange-rate-adjusted one. Treat the combined total as directional in that case, and look at the per-currency breakdown separately.